If Redwood were a country, its citizens would clearly be the smartest, coolest, and best-looking in the world. But would they be the happiest?
The answer to that question might now be clear, as the United Nations recently released the results of a happiness survey. The Bark asked the same question of Redwood students, and compared the results to those of the UN.
The UN’s first World Happiness Report stated, “It makes sense… to pursue policies to raise the public’s happiness as much as it does to raise the public’s national income.”
The report synthesized data from 2005 to 2011 from one question run by the Gallup World Poll, which asked citizens around the world to rate the quality of their lives on a scale of 0 to 10, with 0 being the least happy and 10 being the most. Denmark emerged as the world’s happiest country, and Togo as the world’s least happy, while the United States placed 11th.
Although exact numbers for individual countries were not available, the top four happiest countries (Denmark, Finland, Norway, and the Netherlands) had an average happiness rating of 7.6, while the bottom four countries (Sierra Leone, Central African Republic, Benin, and Togo) had an average rating of 3.4.
The April Bark survey included the same question from the Gallup World Poll. Redwood students reported an average happiness of 6.9, which would place the school in the top 17 to 19 happiest countries. While this means that the average Redwood student is less happy than the average United States citizen, Redwood still occupies a high place on the list of 156 countries.
Sophomore boys composed the happiest group in the school, reporting an average happiness of 7.6, while sophomore girls were the least happy at 6.4. Freshmen girls and senior boys were also among the happiest, both reporting an average happiness of 7.2, while junior boys and senior girls were among the least happy at 6.5 and 6.7, respectively. Boys as a group were happier than girls, at 7.0 compared to 6.8.
Why are these smiling people so happy? What factors are drawing people either above or below the average of 6.9?
According to data from the Bark survey, several factors correlate strongly with the happiness of Redwood students.
[Note: A correlation does not necessarily mean that there is a cause and effect relationship. For example, those with a higher level of perceived wealth were also happier, but this does not necessarily mean that wealth leads to happiness, nor that happiness leads to wealth.]
Sleep: If you’re getting lots of sleep, you’re probably smiling more, as sleep was the factor most strongly correlated with happiness. Students who reported getting over nine hours of sleep every night also reported an average happiness of 9.0, a number higher than any other subgroup in this survey. Happiness levels steadily decreased for those who got less sleep, falling to 6.8 for those who slept six to seven hours, and ending up at 5.8 for those who sleep four hours or fewer.
GPA: For most students, their GPA and happiness are unrelated. But those with a GPA below a 2.5 reported low happiness, averaging 6.2, while those with a GPA above 4.3 reported higher rates of happiness at 7.5. Interestingly, those who did not know their GPA were the happiest, at 7.8.
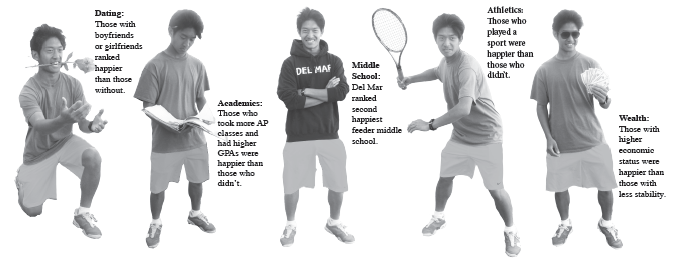
Course load: Loading up on difficult classes might be a smart move in more ways than one. Average happiness ratings were fairly equal for those taking between zero and three AP or honors classes, but jumped to 7.5 for those taking four and 8.0 for those taking five or more.
Sports: Those playing a sport reported an average happiness rating of 7.1, while those who did not reported an average rating of 6.6.
Dating: Although those without a boyfriend or girlfriend reported their happiness at 6.8, students in a relationship were significantly happier at 7.5.
Parents’ relationship: Those whose parents still lived together had an average happiness of 7.2, while students with separated or divorced parents averaged 6.6. Those who reported that one or both of their parents had passed away had an average happiness of 6.0.
Social activity: There was not a direct correlation between a person’s reported happiness and time spent with friends. However, those who rarely or never spend time with friends experienced a significant drop-off from the rest of the subgroups, reporting an average happiness level of 5.0, the lowest of any subgroup in the survey.
Siblings: Happiness levels jumped for those with one or two siblings, but then declined as number of siblings increased. Students without siblings reported an average rating of 6.6, as opposed to 7.0 and 6.9 for those with one and two siblings, respectively. Happiness then fell to 6.4 and 6.0 to those with three and four or more siblings, respectively.
Perceived wealth: Those who perceived their economic status as significantly lower than their peers also reported low happiness, averaging 5.1, while those
who perceived their status as significantly higher had the highest happiness at 8.0. Those in between hovered around the school average of 6.9.
Middle school: Redwood students who previously attended Hall Middle School reported the highest happiness at an average of 7.2, while students from Ross Middle School reported the lowest level of happiness at 5.8. Del Mar graduates were at 6.9 while students from Kent were at 6.7. Students who attended any other middle school reported, collectively, a level of 7.0.
Computer time: The two hour mark seemed to be the happiness cutoff, as those who spent more than two hours a day on the computer reported a collective 6.6, while students who spent less than two hours a day on the computer collectively averaged 7.2.
Healthy habits: Those who never ate junk food reported the highest average happiness at 7.4, but beyond that, happiness was not correlated with junk food
consumption. No correlation was found between alcohol/drug use and happiness or between time spent exercising and happiness.
——————————-
NOTE:
The United Nations report acknowledges that “happiness seems far too subjective, too vague, to serve as a touchstone for a nation’s goals… Yet the evidence is changing this view rapidly. A generation of studies… has shown that happiness, though indeed a subjective experience, can be objectively measured.”
The Gallup World Poll question, also the question used on the Bark survey, is phrased as follows: “Please imagine a ladder with steps numbered from zero at the bottom to 10 at the top. The top of the ladder represents the best possible life for you and the bottom of the ladder represents the worst possible life for you. On which step of the ladder would you say you personally feel you stand at this time?”