
Crowded Classrooms: Exploring the impetus for large class sizes
October 6, 2022
Impacted Class Sizes
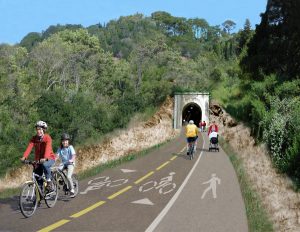
Senior Jordan Slater spends one of her Advanced Placement (AP) classes in a chair without a desk in the back of her class due to a lack of desk space. And she is far from the only one.
“Over my last few years [at Redwood], I have seen an increase in [class sizes]. I am directly affected by this because in my [AP Environmental Science] class, I am sitting in the overflow seating which makes it harder for me to learn, and I can’t see the board as well, [which] limits the information I obtain,” Slater said.
After recent notable teacher layoffs by the district, classes have been consolidated into fewer periods, meaning many teachers are experiencing a record number of students in their classrooms this year. Physiology and Living Earth teacher Jamie Garcia, who has been teaching at Redwood for 23 years, has never seen such an overflow in her classroom.
“This year’s [class sizes] are significantly bigger in all of my science classes,” Garcia said.
The large class sizes have led many to question the root of the issue, whether it has been caused by a budgeting complication, a misappropriation of funds or another underlying issue.
 Student Enrollment
Corbett Elsen, Assistant Superintendent of Business and Operations for the Tamalpais Union High School District (TUHSD), points to a decrease in student enrollment, rather than financial issues, as the primary reason for teacher layoffs. This in turn affects class sizes.
“There are many things [that contributed to the layoffs] but I think the major driver is enrollment decline… There are some individual classes that need to get sorted out [due to high class size numbers],” Elsen said.
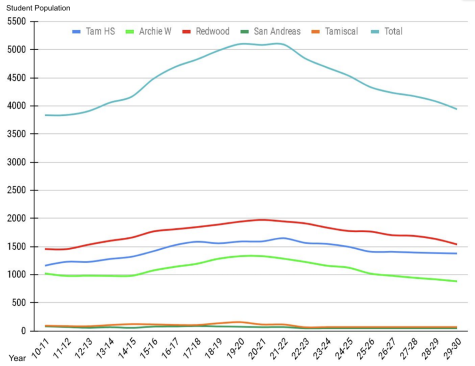
In the last decade, as the district’s student population soared, over 95 new teachers were hired. Conversely, while the 2021-2022 school year saw peak student enrollment, starting this year, the district’s student population will be steadily declining, as reported by the district’s graphs on future student enrollment. According to Elsen, there are currently 1,882 Redwood students this year versus the 1,913 students in the 2021-2022 school year, and due to this decline, the district foresaw an abundance of teachers and thus decided to make layoffs. With fewer teachers in the district, courses are offered in fewer periods, thus contributing to increased class sizes.
However, because of her lack of a desk, Slater finds the current class sizes to be insufficient in providing proper resources and optimal learning conditions for the amount of students in her class. But, Elsen says the current district class size averages are under the previously negotiated maximum: 32 students per class. Looking at the district class size averages for this school year, Elsen points out the average class size this fall semester is only 30 students.
“With the exception being [physical education] at [Tamalpais High School] and Applied Technology at Redwood, all of the department [averages] are actually lower than what we negotiated with the teachers,” Elsen said.
However, the district average does not explicitly show the fact that, in recent years, there has been a recent increase in individual Redwood classes exceeding the negotiated cap, according to the data mentioned in the 2021 School Accountability Report Card (SARC). In addition, the average class size in fall 2020 was around 28 students, two fewer than this year’s average.
As stated by the 2021 SARC, in the 2018-2019 school year, Redwood English, social science, math and science classes had either zero or one class with 33 students or more. However, in the 2020-2021 school year, math, science and social science classroom sizes each rose to 15 classes with 33 students or more, the exception being English with zero classes having 33 students or more. As the district foresees a further decrease in student population, this year’s Redwood class sizes may be larger, but will likely lower in the future as enrollment decreases.
Funding and Budgeting: A Breakdown
While Elsen points to a decline in student enrollment as the main reason for a decrease in teachers, community members such as Slater supposed a different primary reason for the teacher layoffs and impacted classes: budgeting.
“I think it mainly has to do with [the fact the district is] not getting enough funding for how many students we have within the school. … I think it’s a mixture of both [a budgeting issue and a misappropriation of funds by the district]… Could we [take our funds allocated to other places and] pay teachers more, or pay for more teachers? [The latter options] would probably be of better use,” Slater said.
In addition, teachers such as Garcia have been informed that a lack of funds is why Redwood cannot provide enough teachers for its student population.
“[The district] had to minimize hiring new teachers and fill class sizes to the maximum [so they could] maximize their funds and money,” Garcia said.
For the 2022-2023 school year, the Tamalpais Union High School District (TUHSD) has a combined general fund of $106,511,892 for all of the district’s schools: Redwood, Tamalpais (Tam), Archie Williams, San Andreas and Tamiscal. A general fund is sourced through taxes and government aid and is used for teacher and staff salaries, support services, such as counselors, and school supplies. With roughly 5,000 students in the district, revenues are allocated so the general fund is evenly split among each student, at around $21,302 per student. Redwood has the highest student population in the district, currently at 1,882 students, and therefore receives the largest sum of taxes allocated: roughly $40,090,364.
According to Elsen, property and parcel taxes, a form of real estate taxes, primarily pay for teacher salaries, whereas state and federal taxes mainly fund resources and services on campus.
Information regarding the district’s budgeting and appropriation of taxpayer money is included on the TUHSD website. Elsen summarized a basic rundown of how the district allocates its tax money.

“Eighty-five percent of our budget is spent on teachers, counselors, assistant principals, food service and custodians. At least 15 percent of expenditures are not spent on people, [but rather] textbooks, Chromebooks, pencils, paper, art supplies and lab supplies,” Elsen said.
Elsen also mentioned part of the 15 percent of expenditures, which are mostly paid for by state and federal funds, includes services such as free therapy and counseling for students, special education, free meals in the cafeteria and campus renovations and construction.
As shown in the graph “Combined TUHSD District Expenditures,” 85 percent of tax funds are always spent on salaries and benefits. The other 15 percent of tax funds were spent on books and supplies, capital outlay (money spent to acquire, maintain, repair or upgrade capital assets), other operating expenditures and other outgo (“Includes outlays for debt service, transfers between funds within a district and transfers to other agencies,” according to EdSource). See the figure for specific values.
According to the June 2022 TUHSD Budget Adoption, for the 2021-2022 school year, the district increased spending on acquiring technology devices and Chromebook carts, summer school nutrition, special education and capital facilities projects. While the district’s total tax revenues are $106,511,892, its total expenditures are equal to $108,486,372; the extra $1,974,480 in expenditures were taken out of the district’s savings account.
As for increased spending on teacher salaries, Redwood has continued its pre-approved compounding growth rate, which started in the 2020-2021 school year; last year, teacher salaries increased by 2.5 percent on top of the prior year’s raise, and this school year, teachers’ salaries increased by 3 percent.
Parcel Taxes: Measures B and M
A large contributor to a decrease in Redwood’s funds are the parcel taxes from 2020. The first proposed parcel tax for TUHSD funding, Measure B, failed to pass in March of 2020 as it fell short of the two-thirds voter majority. Eight months later, in November 2020, Measure M was proposed and passed at a lower dollar threshold of $16.8 million.
“Our voters approved Measure M to tax themselves further to provide specific classes and electives,” Elsen said.
Although the district states they are very grateful for having a supportive community, the failure of Measure B in 2020, which had a higher tax rate than M, caused a great loss of funds for the school.
“The difference is somewhere around $5 to $6 million dollars every year of less funding we now have as a result of Measure B failing and having to pass Measure M,” Elsen said.
This is vital, as the funds raised by parcel taxes directly go to teacher and counselor salaries. This means that Redwood and the district face $5 to $6 million dollars less for teacher salaries every year due to Measure B not passing.
Many factors have led to a significant spike in class sizes and a decrease in teachers. However, given everyone’s different perspectives and testimonies, it remains unclear as to if there was a primary cause; as a result, it is difficult to determine whether Redwood’s current situation is because of reduced enrollment or a financial issue (a lack of tax funds generated for the district or a lack of funds allocated to teacher salaries). However, it is clear both of these factors of decreased student enrollment and lower amounts of district tax funds played a role in the changes we see in our classrooms across the district today.